Sections:
MCMC Post-hoc Analysis: 25 sequences

directory: /home/biodept/br51/Work
subdirectory: 25-6
command line: bali-phy 25.fasta --smodel GTR+DP[4]
directory: /home/biodept/br51/Work
subdirectory: 25-7
command line: bali-phy 25.fasta --smodel GTR+DP[4]
directory: /home/biodept/br51/Work
subdirectory: 25-8
command line: bali-phy 25.fasta --smodel GTR+DP[4]
directory: /home/biodept/br51/Work
subdirectory: 25-9
command line: bali-phy 25.fasta --smodel GTR+DP[4]
| Partition | Sequences | Lengths | Substitution Model | Indel Model |
|---|
| 1 |
25.fasta |
111 - 131RNA nucleotides |
GTR+DP[4] |
RS07 |
| burn-in = 10000 samples |
sub-sample = 10 |
P(data|M) = -2725.989 +- 0.446
|
| Complete sample: 35951
topologies |
95% Bayesian credible interval: 34151 topologies |
| chain # | Iterations (after burnin) |
|---|
| 1 |
90000 samples |
| 2 |
90000 samples |
| 3 |
90000 samples |
| 4 |
90000 samples |

| Partition support: Summary |
| Partition support graph: SVG |
Partition 1
|
|
|
Diff |
|
Min. %identity |
# Sites |
Constant |
Informative |
| Initial |
FASTA |
HTML |
Diff |
|
12.7% |
131 |
0 (0%) |
126 (96.2%) |
| Best (WPD) |
FASTA |
HTML |
|
AU |
31.2% |
198 |
11 (5.56%) |
124 (62.6%) |
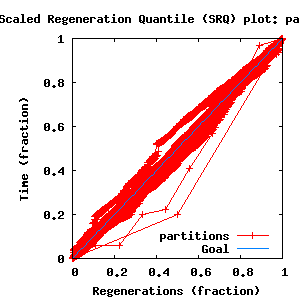
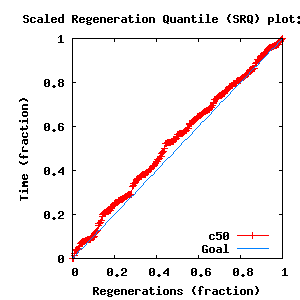
- Partition uncertainty
- SRQ plot: partitions
- SRQ plot: c50
- Variation in split frequency estimates
| burnin (scalar) | Ne (scalar) | Ne (partition) | ASDSF | MSDSF | PSRF-CI80% | PSRF-RCF |
|---|
| 920 | 425.7 | 877.654 | 0.012 | 0.038
| 1.001 | 1.005 |


| Statistic | Median | 95% BCI | ACT | Ne | burnin | PSRF-CI80% | PSRF-RCF |
|---|
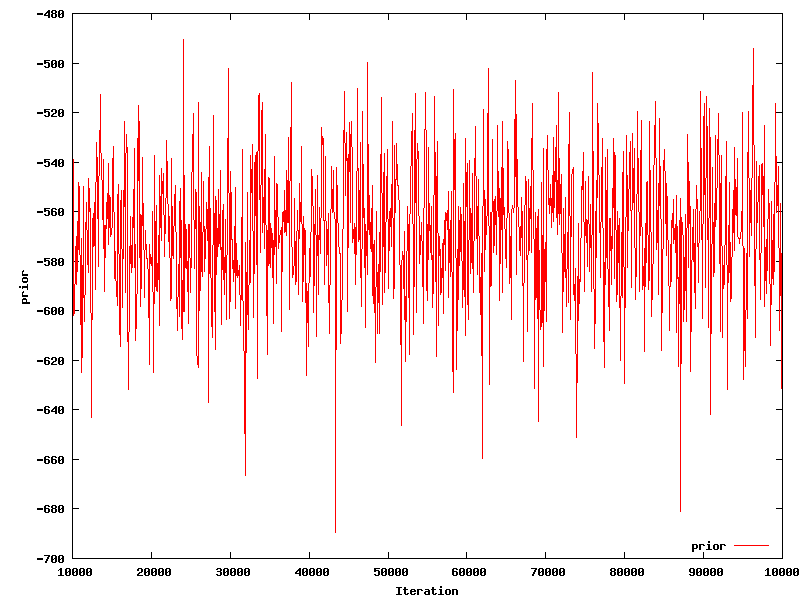
| prior |
-567.5 |
(-627.9, -517.6) |
11.46 |
3140 |
338
|
1.001 | 1.002
| Trace |
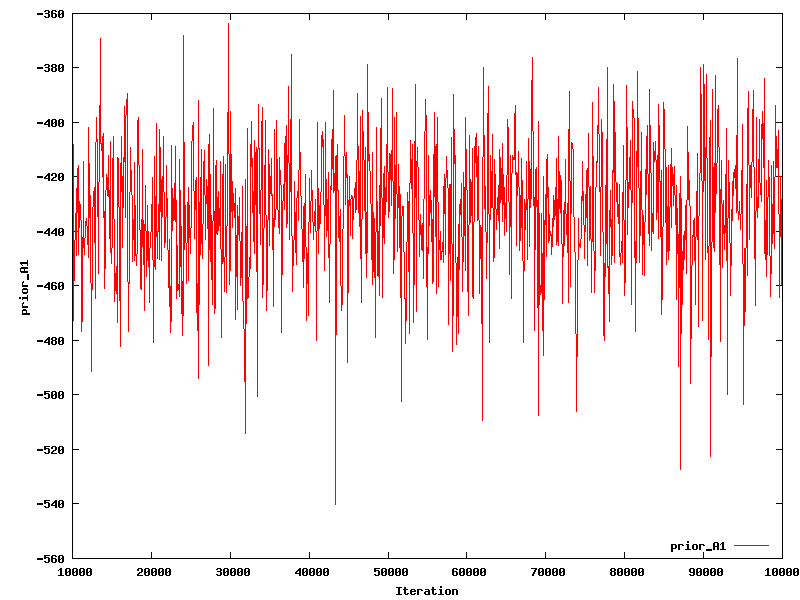
| prior_A1 |
-431.2 |
(-486.9, -388.8) |
8.606 |
4183 |
158
|
0.9997 | 1.005
| Trace |
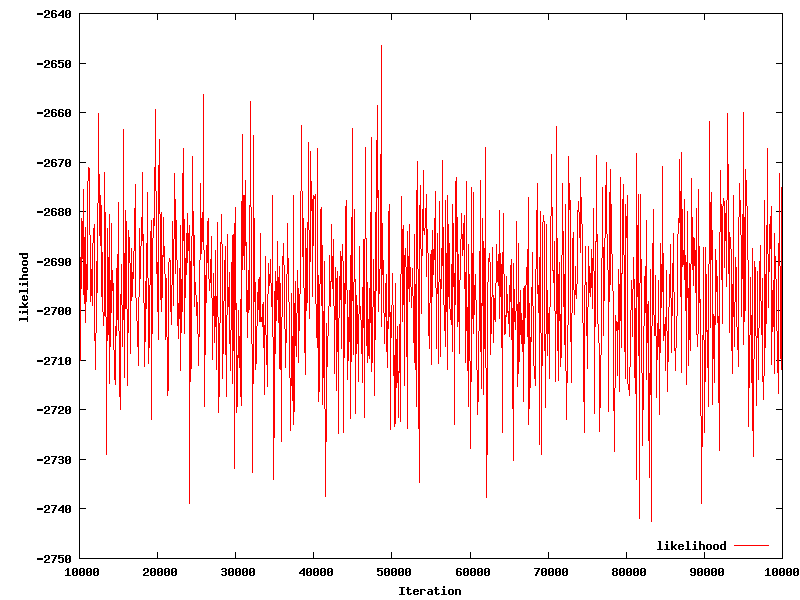
| likelihood |
-2696 |
(-2725, -2666) |
10.65 |
3381 |
182
|
1.001 | 1
| Trace |
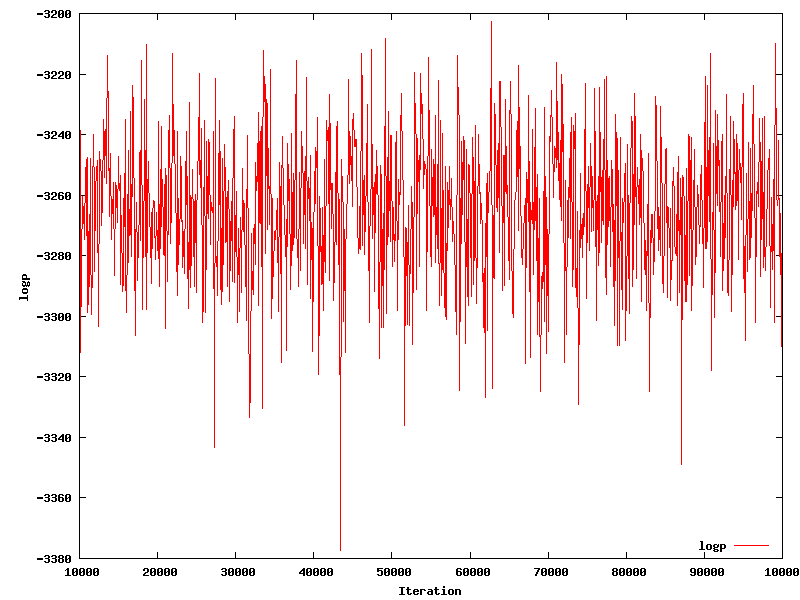
| logp |
-3263 |
(-3314, -3220) |
9.763 |
3687 |
158
|
1.001 | 1.005
| Trace |
| Heat.beta |
1 |
| | | |
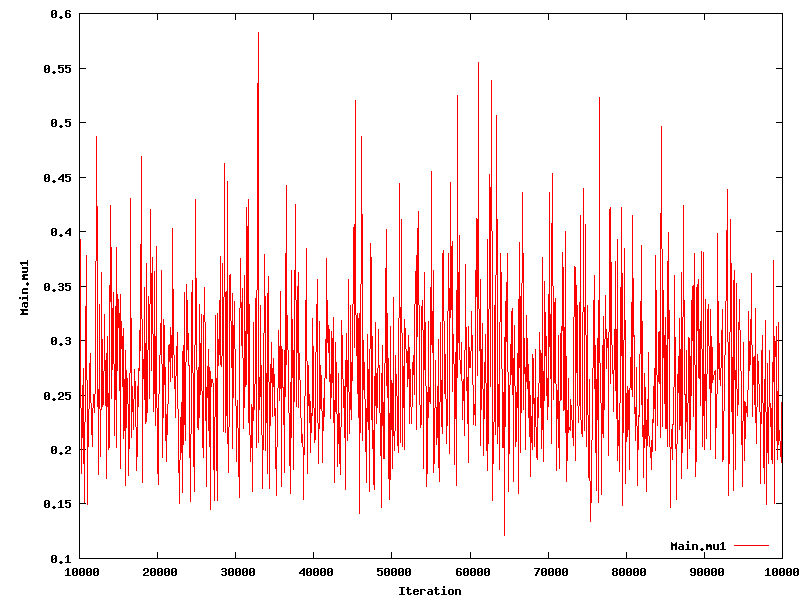
| Main.mu1 |
0.2622 |
(0.1645, 0.4394) |
1.464 |
24600 |
122
|
1 | 0.9978
| Trace |
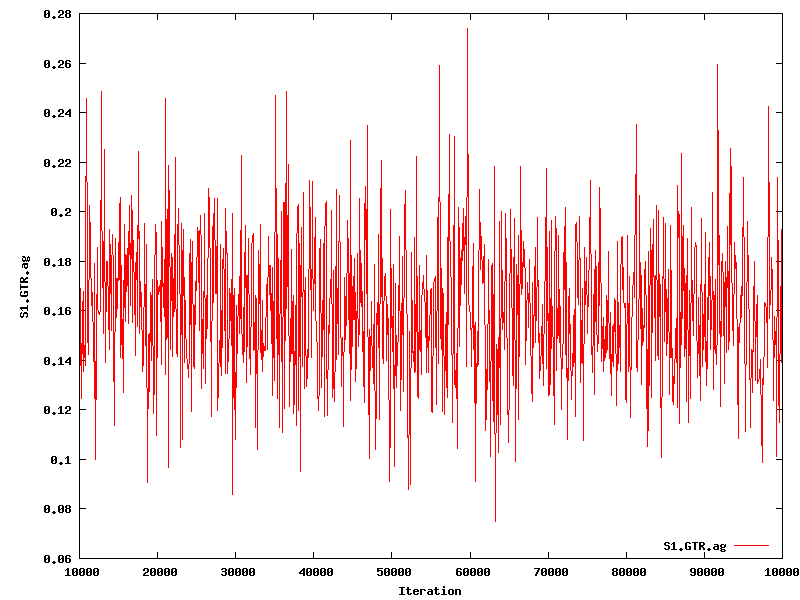
| S1.GTR.ag |
0.1601 |
(0.1113, 0.2214) |
1.442 |
24971 |
152
|
0.9999 | 1.001
| Trace |
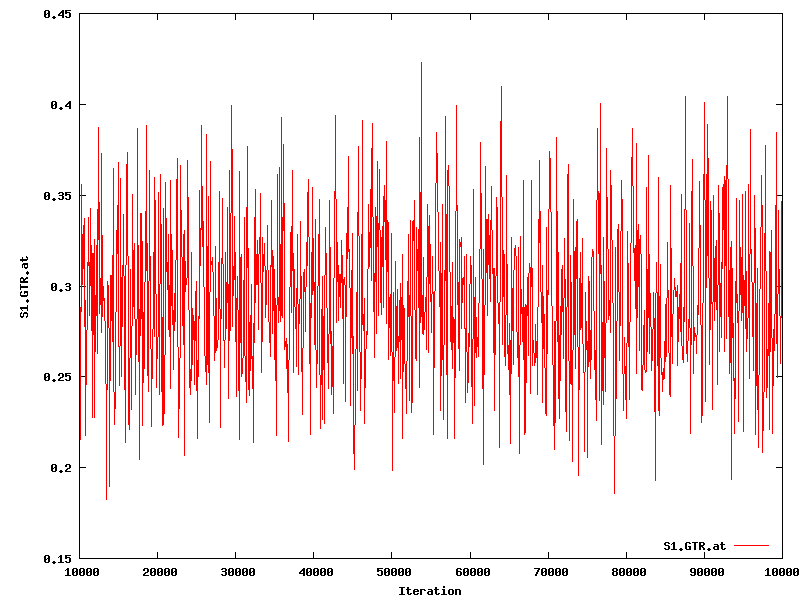
| S1.GTR.at |
0.2911 |
(0.2102, 0.3807) |
1.387 |
25963 |
143
|
0.9998 | 0.9997
| Trace |
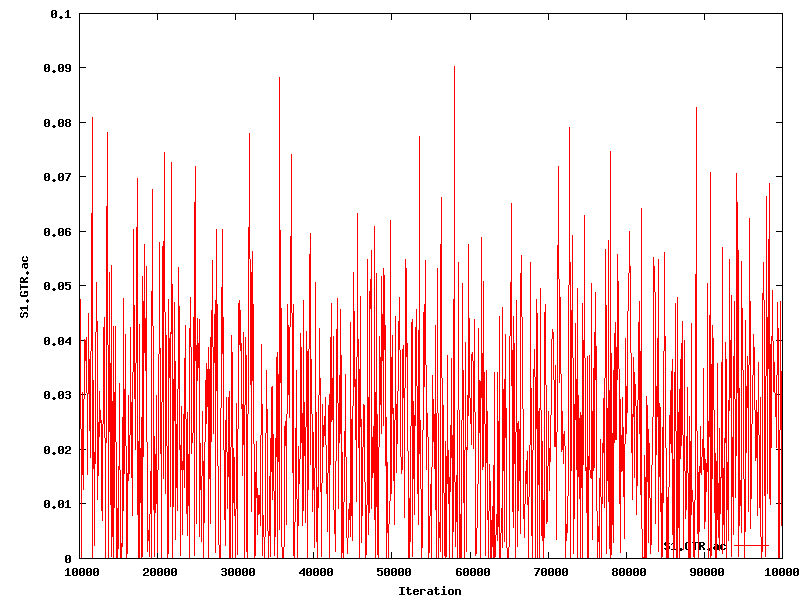
| S1.GTR.ac |
0.02198 |
(0, 0.06543) |
2.498 |
14414 |
184
|
1.001 | 0.9991
| Trace |
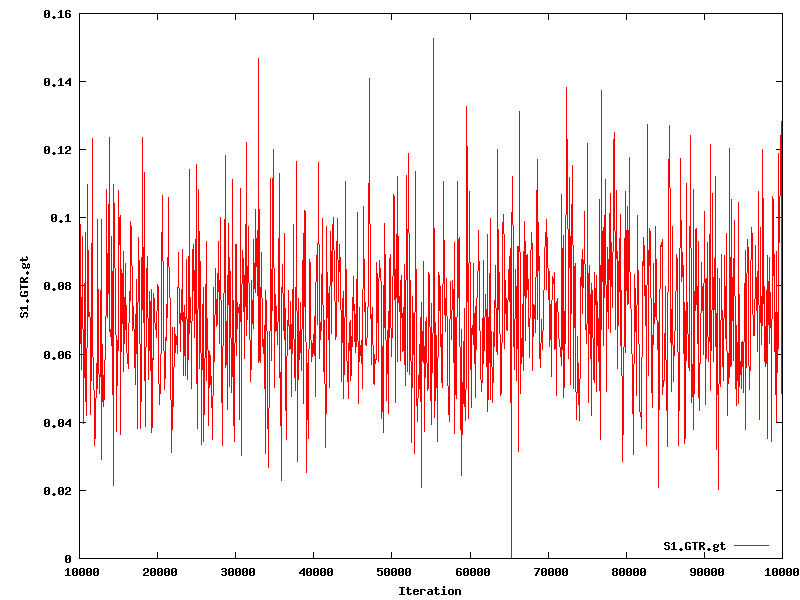
| S1.GTR.gt |
0.07066 |
(0.03299, 0.1172) |
3.162 |
11386 |
128
|
0.9999 | 1.005
| Trace |
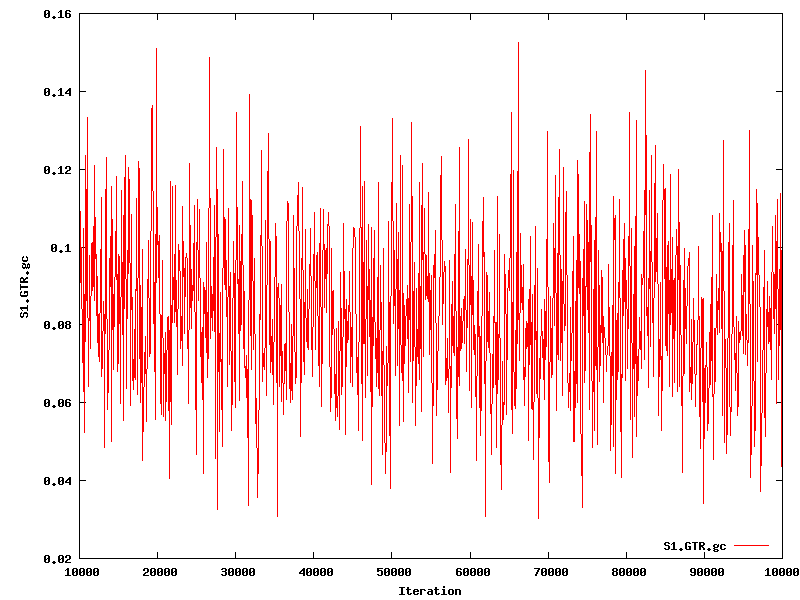
| S1.GTR.gc |
0.08016 |
(0.04423, 0.1269) |
2.867 |
12556 |
193
|
0.9997 | 0.9996
| Trace |
| S1.GTR.tc |
0.3677 |
(0.2872, 0.4551) |
1.961 |
18360 |
79
|
1 | 0.9975
| Trace |
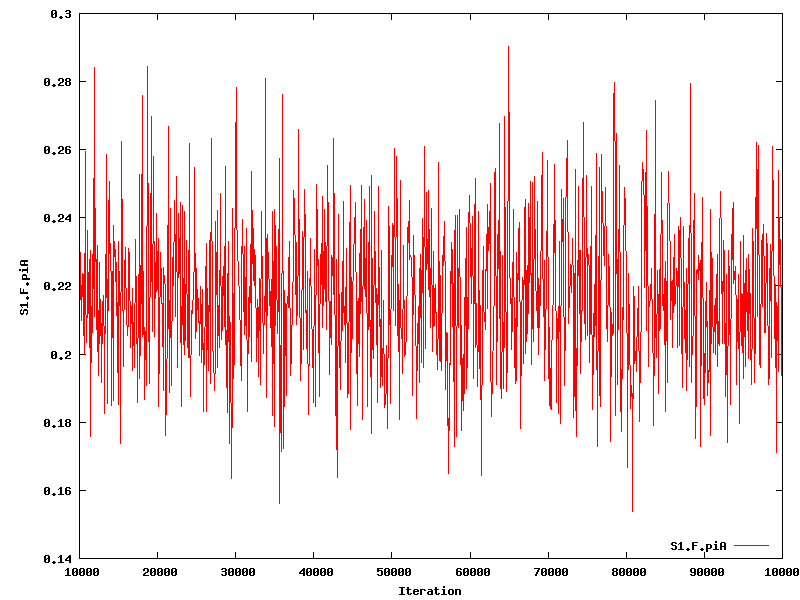
| S1.F.piA |
0.2149 |
(0.1773, 0.2596) |
1.674 |
21512 |
129
|
1.001 | 1.001
| Trace |
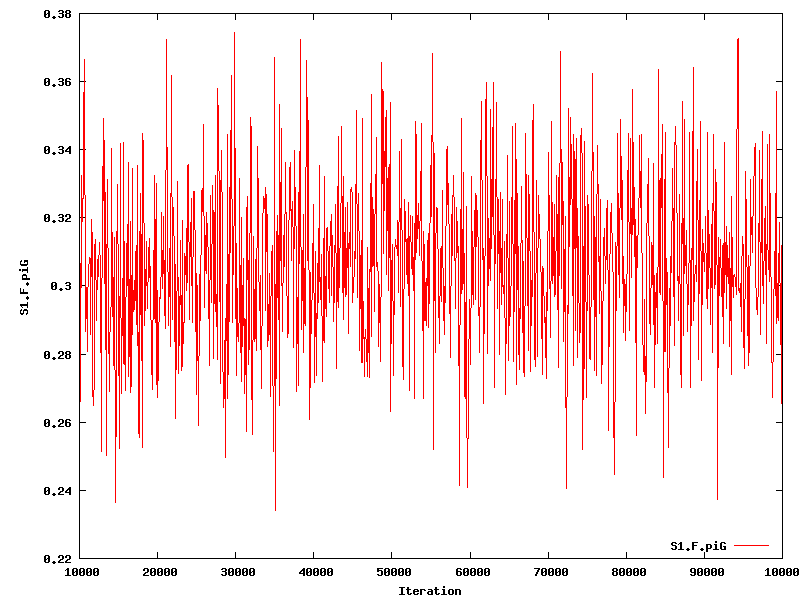
| S1.F.piG |
0.3056 |
(0.2602, 0.3539) |
1.385 |
25997 |
135
|
1 | 0.9997
| Trace |
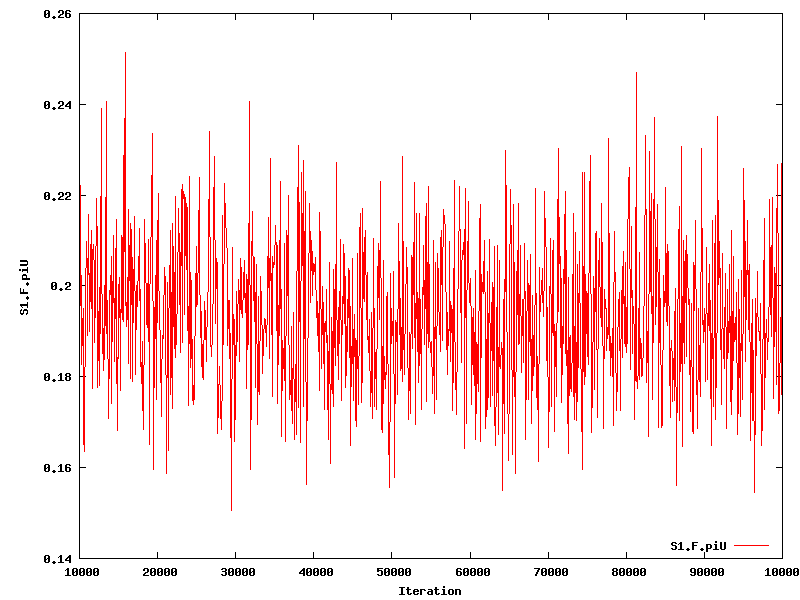
| S1.F.piU |
0.1938 |
(0.1656, 0.2264) |
2.777 |
12967 |
239
|
0.9999 | 0.9939
| Trace |
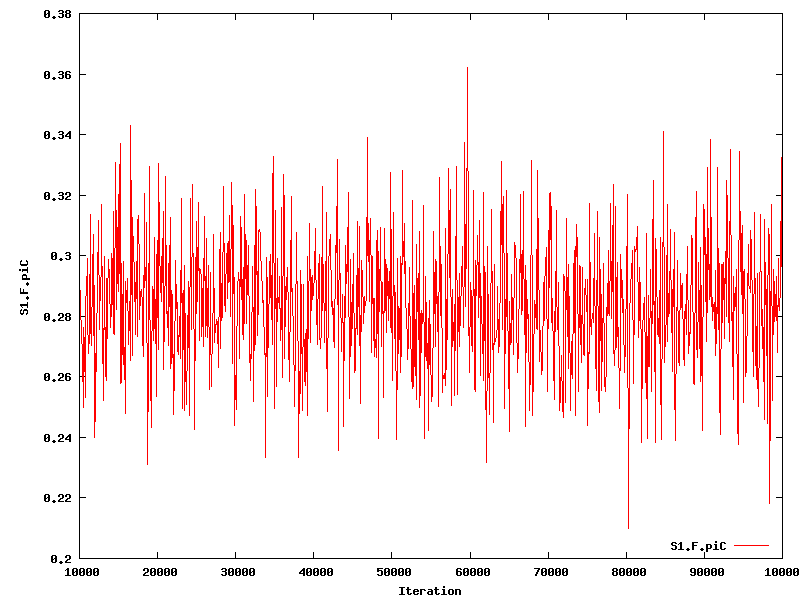
| S1.F.piC |
0.2836 |
(0.2445, 0.3265) |
1.975 |
18232 |
114
|
1.001 | 0.9974
| Trace |
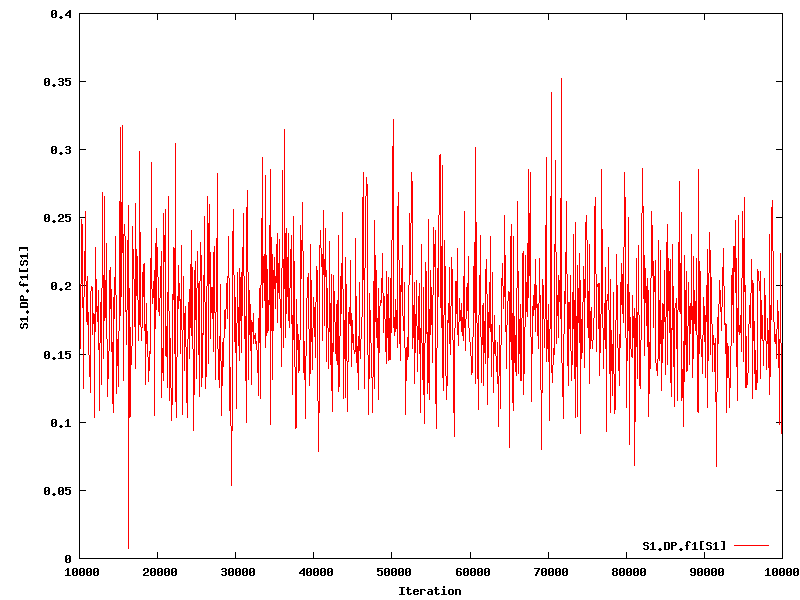
| S1.DP.f1[S1] |
0.174 |
(0.1, 0.2706) |
1.256 |
28655 |
190
|
1 | 0.996
| Trace |
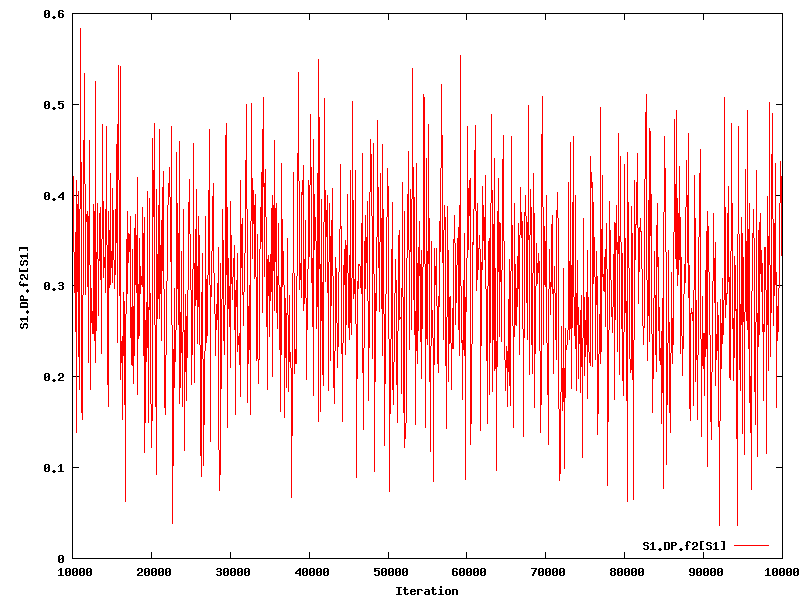
| S1.DP.f2[S1] |
0.2992 |
(0.1048, 0.4885) |
1.059 |
34003 |
68
|
1.001 | 1
| Trace |
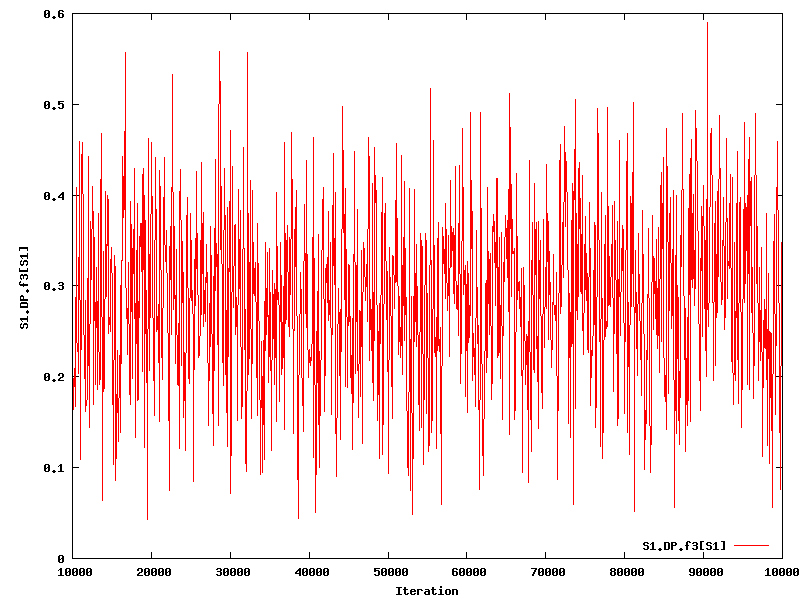
| S1.DP.f3[S1] |
0.2915 |
(0.09519, 0.4738) |
2.042 |
17633 |
122
|
1.001 | 1.005
| Trace |
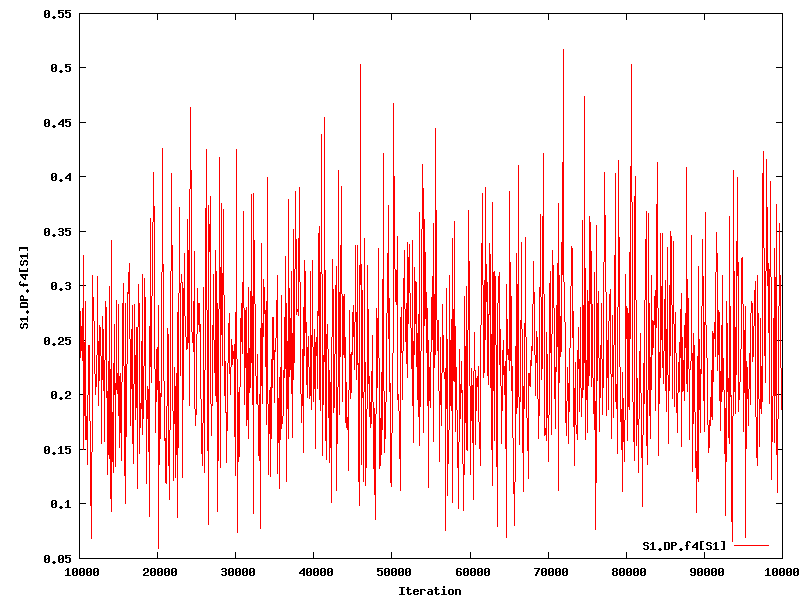
| S1.DP.f4[S1] |
0.2315 |
(0.09811, 0.3996) |
2.87 |
12543 |
92
|
0.9996 | 0.9982
| Trace |
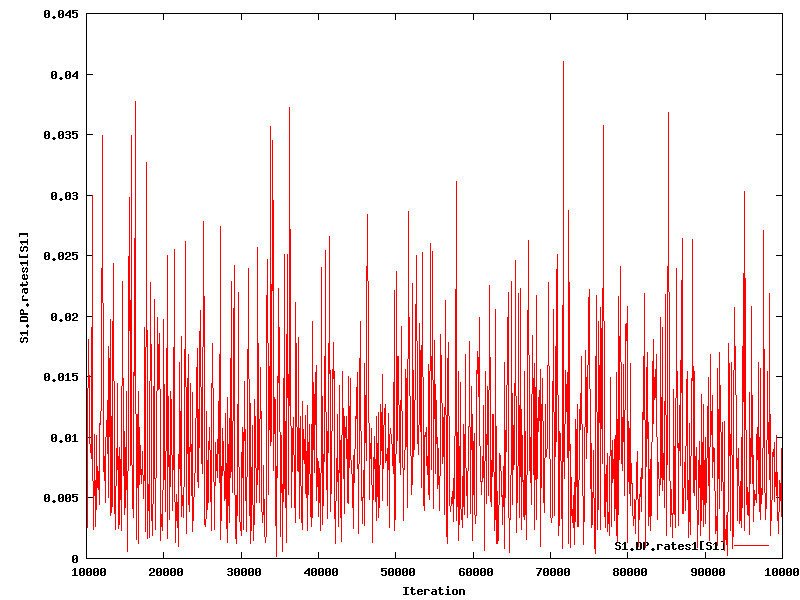
| S1.DP.rates1[S1] |
0.007786 |
(0.001219, 0.02499) |
1.429 |
25192 |
244
|
0.9999 | 0.9996
| Trace |
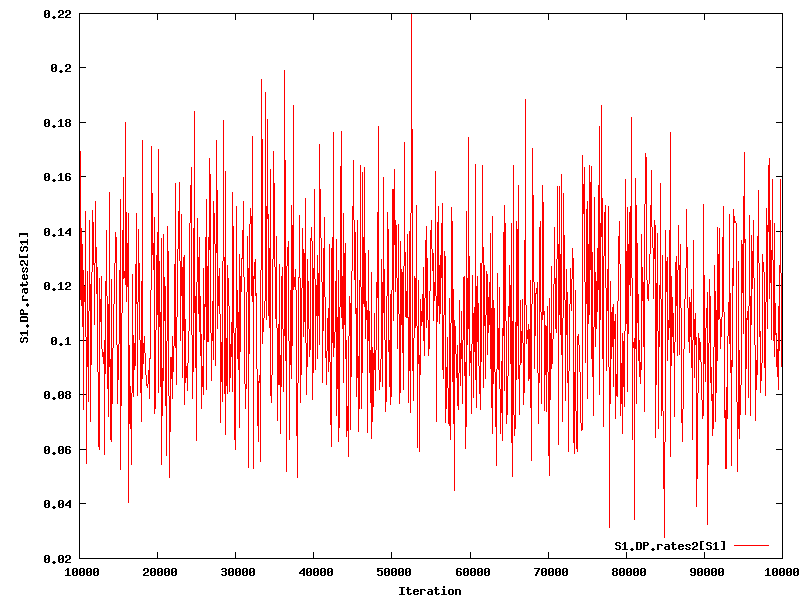
| S1.DP.rates2[S1] |
0.1067 |
(0.05853, 0.1708) |
3.132 |
11494 |
213
|
0.9992 | 0.9946
| Trace |
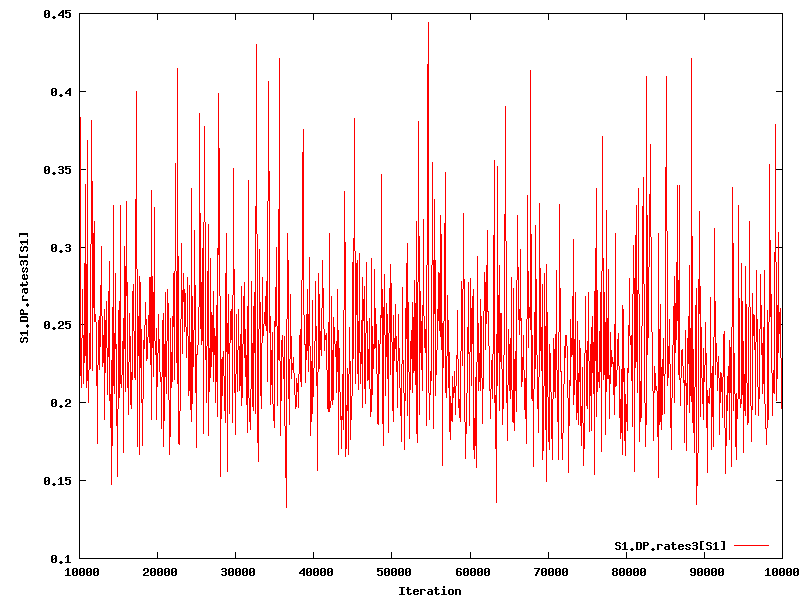
| S1.DP.rates3[S1] |
0.2295 |
(0.1642, 0.3693) |
2.215 |
16251 |
105
|
1 | 0.9947
| Trace |
| S1.DP.rates4[S1] |
0.6489 |
(0.4967, 0.7554) |
3.677 |
9790 |
156
|
0.9976 | 0.991
| Trace |
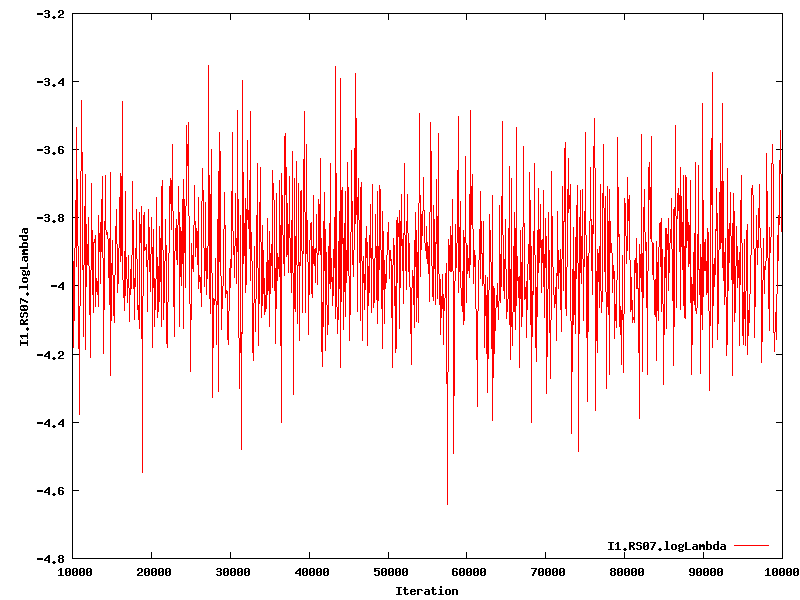
| I1.RS07.logLambda |
-3.919 |
(-4.289, -3.551) |
2.037 |
17672 |
141
|
1.001 | 1
| Trace |
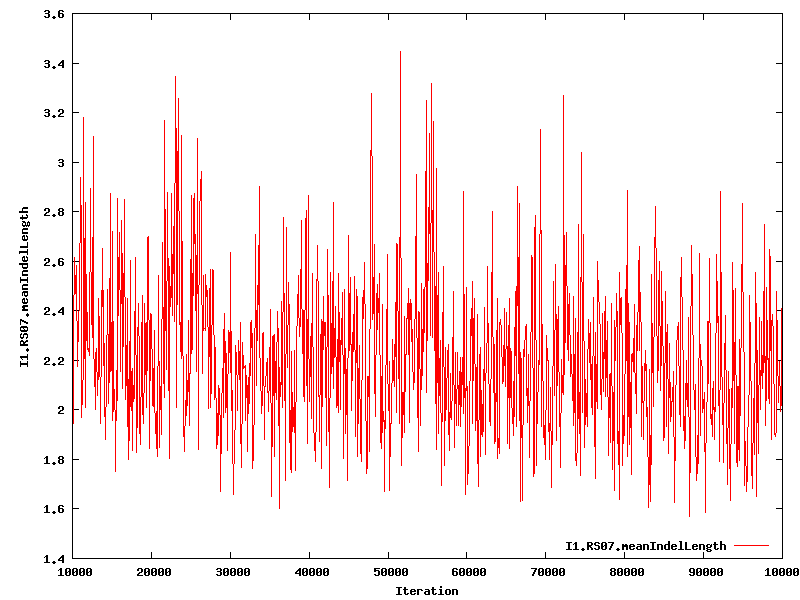
| I1.RS07.meanIndelLength |
2.162 |
(1.714, 2.893) |
17.96 |
2005 |
341
|
1 | 0.9961
| Trace |
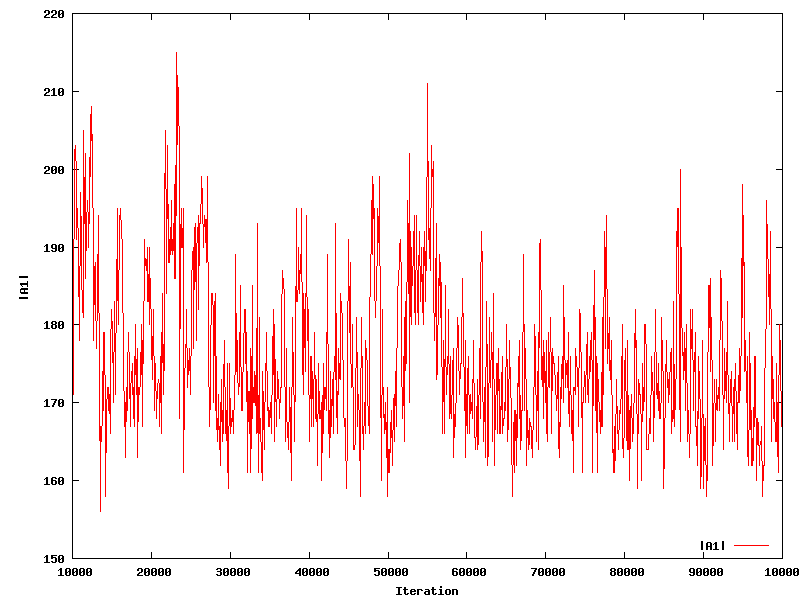
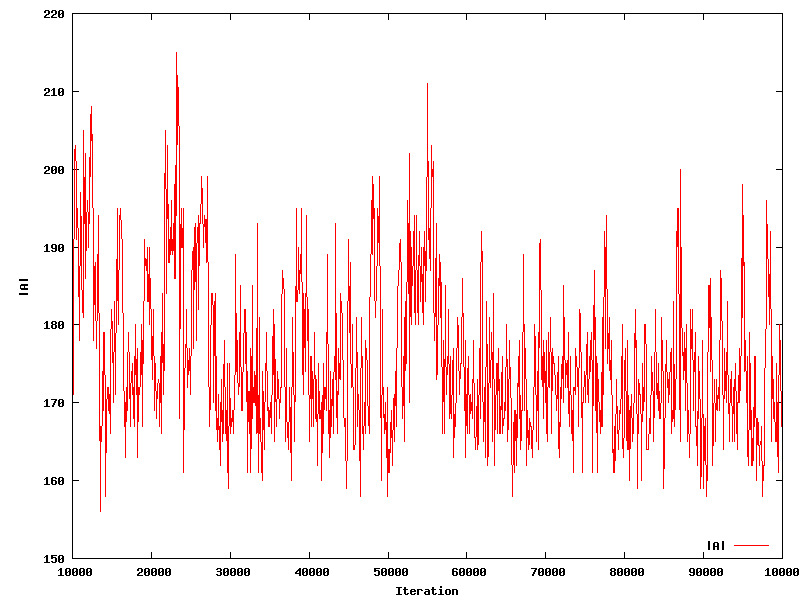
| |A1| |
174 |
(161, 199) |
84.59 |
425 |
920 |
0.9231 | 0.9873
| Trace |
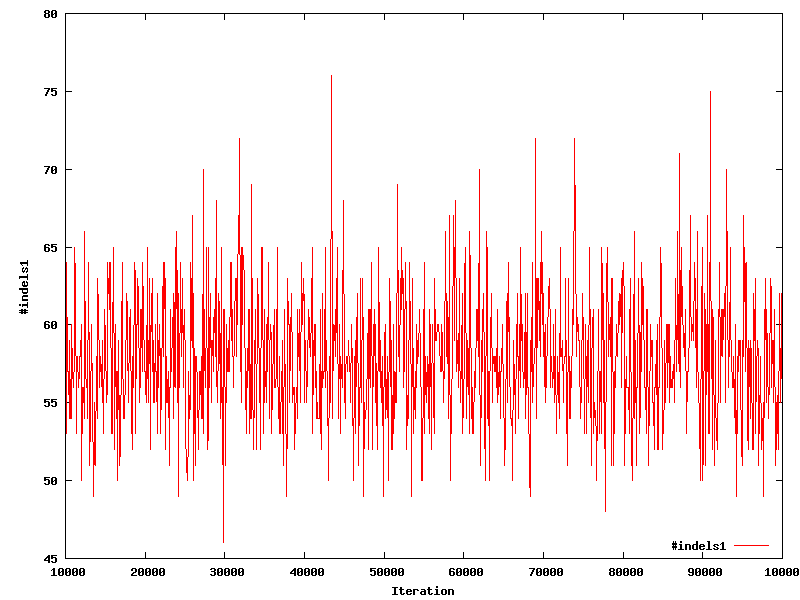
| #indels1 |
58 |
(50, 67) |
6.318 |
5698 |
130 |
0.9091 | 1.005
| Trace |
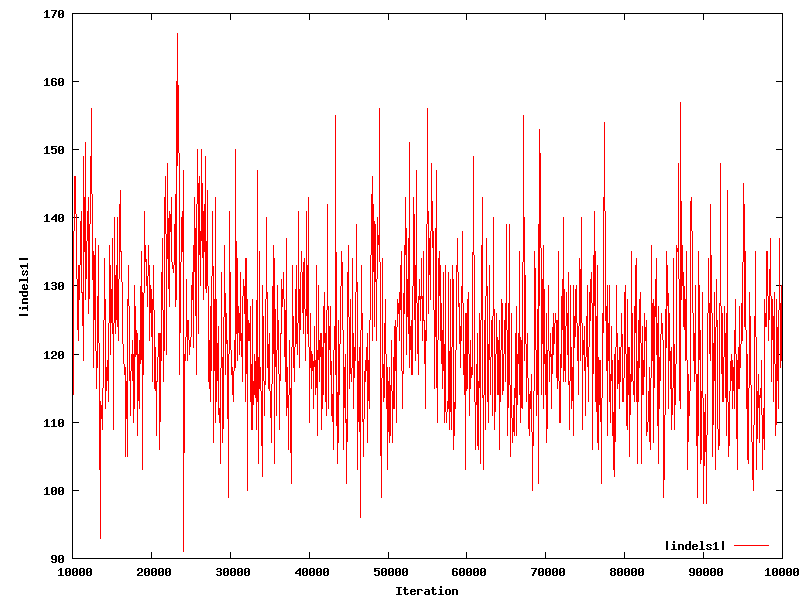
| |indels1| |
121 |
(103, 149) |
32.7 |
1100 |
337 |
0.9587 | 0.9969
| Trace |
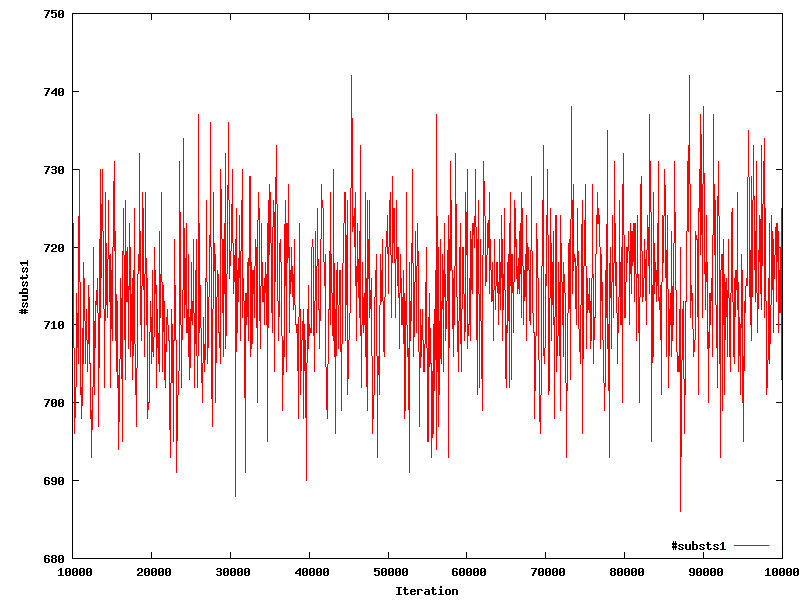
| #substs1 |
714 |
(695, 731.4) |
25.23 |
1426 |
328 |
0.9644 | 0.9879
| Trace |
| |A| |
174 |
(161, 199) |
84.59 |
425 |
920 |
0.9231 | 0.9873
| Trace |
| #indels |
58 |
(50, 67) |
6.318 |
5698 |
130 |
0.9091 | 1.005
| Trace |
| |indels| |
121 |
(103, 149) |
32.7 |
1100 |
337 |
0.9587 | 0.9969
| Trace |
| #substs |
714 |
(695, 731.4) |
25.23 |
1426 |
328 |
0.9644 | 0.9879
| Trace |
| |T| |
11.88 |
(9.365, 15.89) |
3.476 |
10358 |
171
|
1.001 | 0.9962
| Trace |