
Example analyses with results
- 5S rRNA - 25 sequences
(BAli-Phy 4.3)
% bali-phy 25.fasta --smodel 'GTR +> ASRV.Gamma(4) +> Inv +> Covarion.Huelsenbeck02'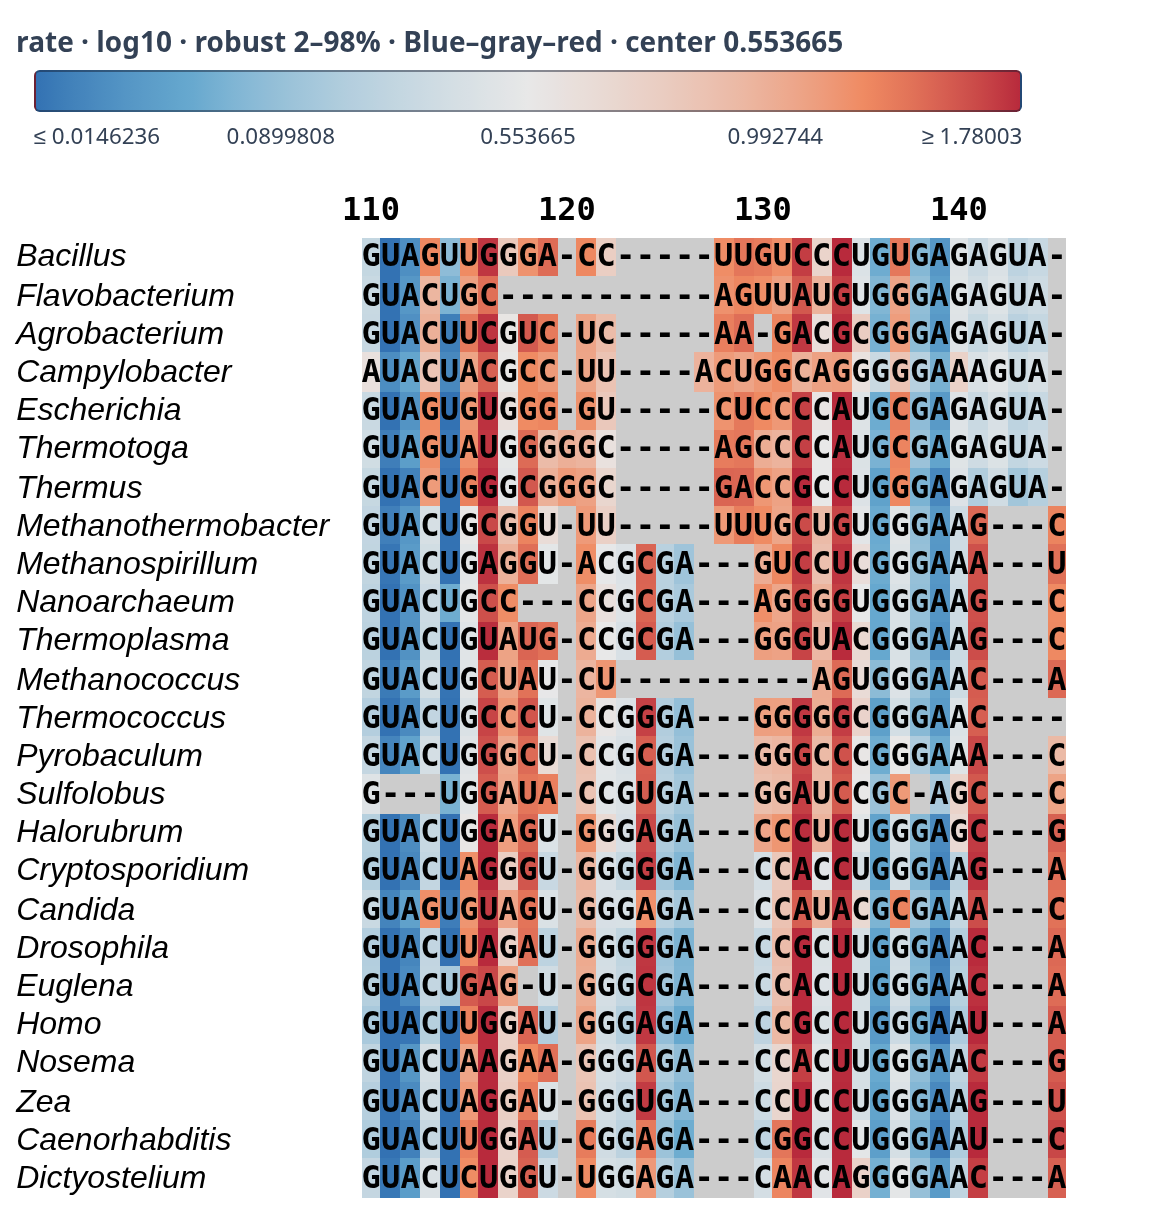
Letters in the same column can have different inferred rates. This covarion analysis illustrates rate variation among lineages (heterotachy). Blue indicates lower posterior mean rates and red higher rates. Compare the rows around columns 130–140. Full-resolution image. Explore the interactive alignment. Select rate, turn off Original colors, and choose Log10 to reproduce these colors.
Older example analyses
These reports were generated with older versions of BAli-Phy. Their commands and output have not yet been updated for version 4.3.
- 5S rRNA - 48 sequences
% bali-phy 48-fsa.fasta --smodel "gtr +> Rates.gamma(4) +> inv" - Globins - 28 sequences
% bali-phy few-globins.fasta --smodel "lg08 +> Rates.free(n=5)" - ITS1 + 5.8S + ITS2 - 68 sequences
% bali-phy -c ITS.txt --name ITS-3.1.5